How often have you had a web site appear to load quickly, only to find that you couldn’t actually click or scroll for a while? Sometimes a site can have a fast first paint, but if the page isn’t also interactive quickly, users can quickly grow frustrated, and even leave the page.
Interactivity Metrics
In a recent post on perfplanet.com, Patrick Meenan writes about two different metrics related to measuring a page’s interactivity: Time to Interactive and Time to Consistently Interactive.
Time to Interactive (TTI) is a Chrome-specific measurement that measures the earliest point after the main content has rendered where the page is responsive (for at least 5 seconds).
Time to Consistently Interactive is the earliest point after the main content has rendered where the page can be expected to always be responsive.
The reason there are two different metrics is it’s possible to delay loading some (or most) of the page’s JavaScript until after the initial page render. This would allow there to be quick initial paint, and even some quick interaction.
But it’s possible, depending on what is loaded, and how it’s loaded, that this delayed JavaScript could cause hiccups in the interactivity of the page. Thus, keeping an eye on the Time to Consistently Interactive can give us an idea of if there are issues after the initial load that we may need to address.
Keeping an eye on both metrics can also be valuable in pinpointing potential performance issues stemming from 3rd party scripts. Even if your site isn’t doing much with JavaScript itself, if it’s loading external scripts – say, for loading ads or managing comments, etc – you may still run into interaction issues.
Finding the Numbers
So how do you know what these numbers are? Here are 3 places you can check.
DevTools > Audits (Lighthouse)
One easy way is to use Lighthouse from within Chrome DevTools. In DevTools, go to the Audits tab, and run Lighthouse. Under the performance metrics, time to First Interactive and Consistently Interactive are spelled out.
The best part of this is the simplicity of it. You run the audit, and it spits out a number.
DevTools > Performance
You can view some of the same things in the Performance tab in Chrome’s DevTools. Once on the tab, you can profile the page, page keeping an eye out for red bars at the top that signify performance issues. The time to consistently interactive is where the when red bars stop for good.
Although it doesn’t spit out a score like Lighthouse does, it does gives you the ability to drill down into what scripts where running at any specific moment, enabling you to better pinpoint the cause of any issues.
WebPageTest
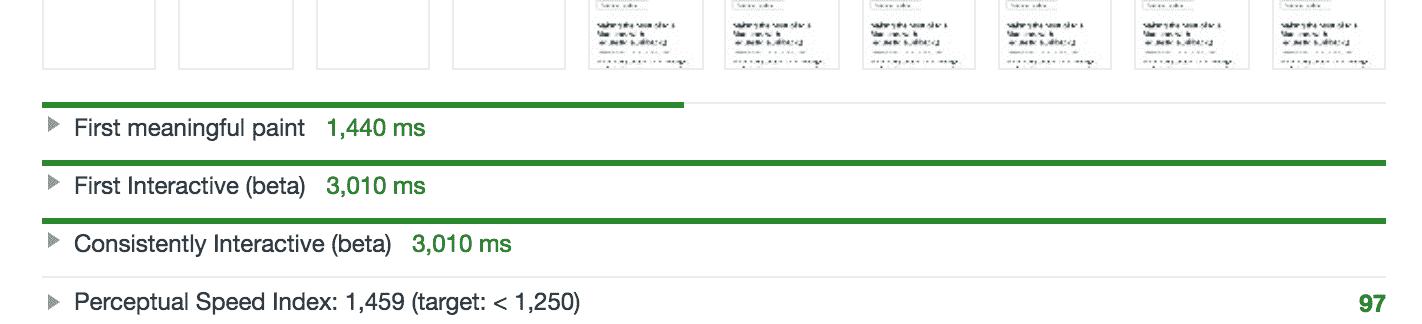
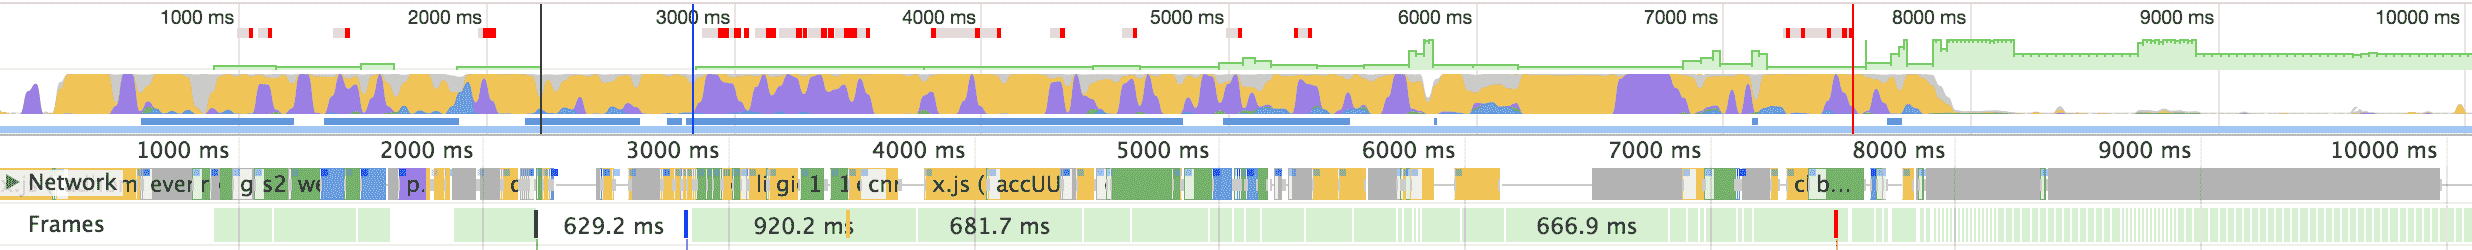
WebPageTest will also show these details, as Meenan demonstrates in his article. After running WPT on your site, you can go to ‘Details’. At the top, you’ll see a ‘First Interactive (Beta)’ label, which lists your TTI time.

At the bottom, if applicable, the chart will show a green and red bar labeled as ‘Page is Interactive’. This goes along with a view of the usage of the main JavaScript thread.
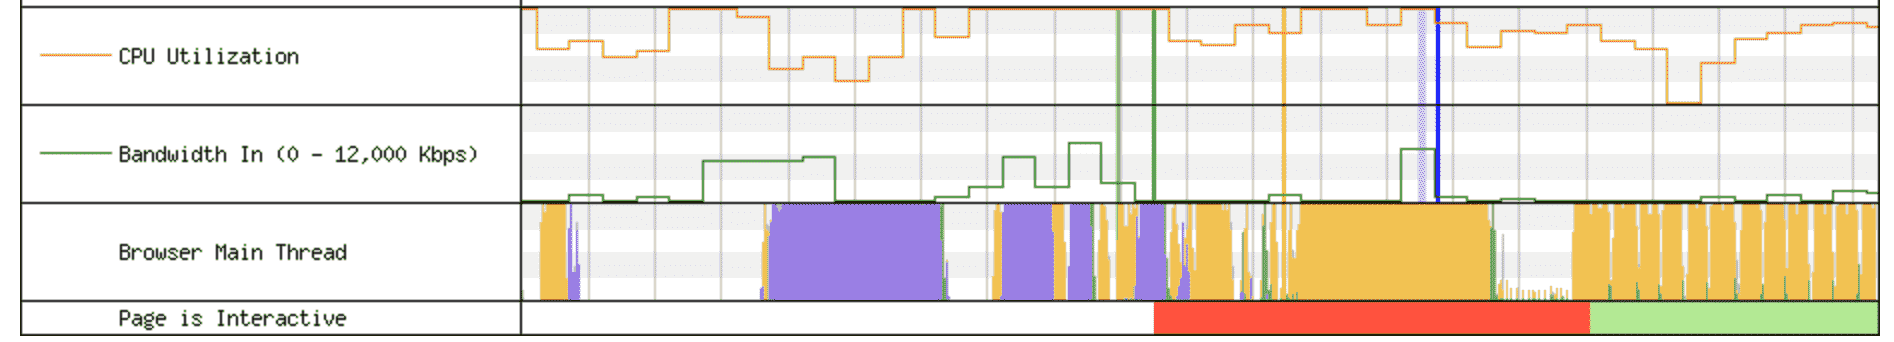
The ‘Time to Consistent Interactive’ metric would be wherever the last red lines happens, even if it’s way after the initial load. The article listed above has several graphics, and a more in-depth explanation.
Conclusion
TTI can TT(C)I are not the only numbers that matter, but they are important to keep an eye on. Especially if we want to minimize the chances of users hitting a webpage that looks like it’s loaded, but isn’t actually interactive when they go to use it.
Links
-
Time To Interactive – Measuring more of the user experience, by Patrick Meenan
-
Time to Interactive, WebPageTest Docs