One of the fundamental ways of improving webpage performance is to reduce the size of the files that are being sent over the wire. Images are often an early target for optimization, but other files — like those used for HTML, CSS, and JavaScript — can provide plenty of room for improvement. The CSS and JavaScript files used for a site, for instance, can grow fairly large now days, especially if 3rd party framework are involved. So how do you reduce the size of these files?
Some popular ways optimizing these files include concatenating, minifying, and compressing them. But even more basic than these techniques is paring down what we even put in these files to start with — sending only those elements (and files) that are actually needed. Because although minifying and compressing are great, if we’re compressing unnecessary data, we still end up behind where we’d be if we didn’t send it in the first place.
But how do we know what’s actually necessary and what’s not? Today we’ll look at a quick way to see how much of the CSS and JS files on a page are actually being used, and how much might be able to be removed.
Code Coverage in Dev Tools
Although there are command line tools that can help lint your JS and CSS (like the unCSS node module, for instance), today I’ll be focusing on a handy tool baked into Chrome Dev Tools that can give you a quick overview of which files may be good candidates for pruning.
- First, in the current version of Chrome (v 58.0.x), this tool is still technically an ‘experiment’, so you’ll need to enable it. Go to
chrome://flagsin Chrome, and make sure ‘Developer Tool Experiments’ is enabled (this may require a browser relaunch).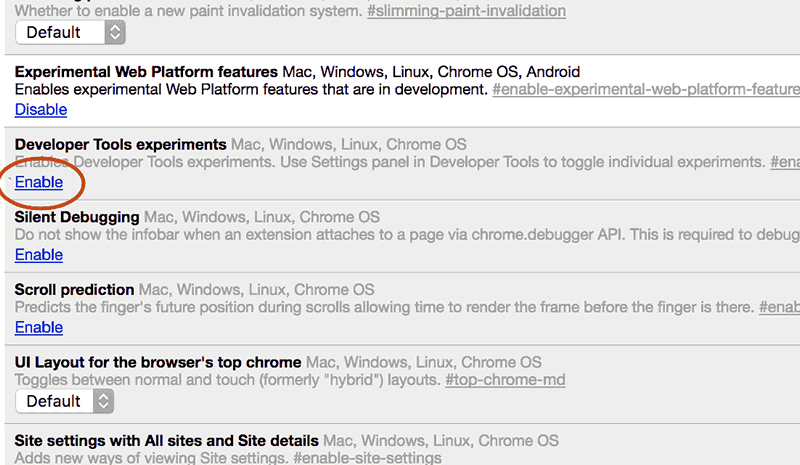
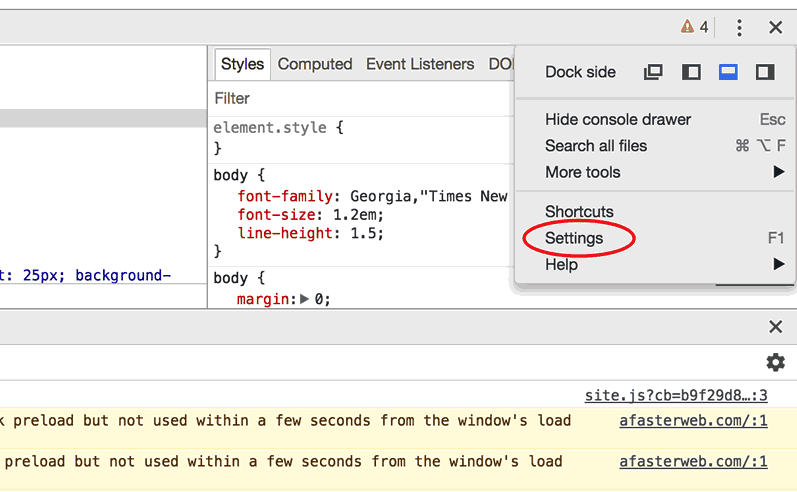
- Now, open up Dev Tools, and go to ‘Settings’
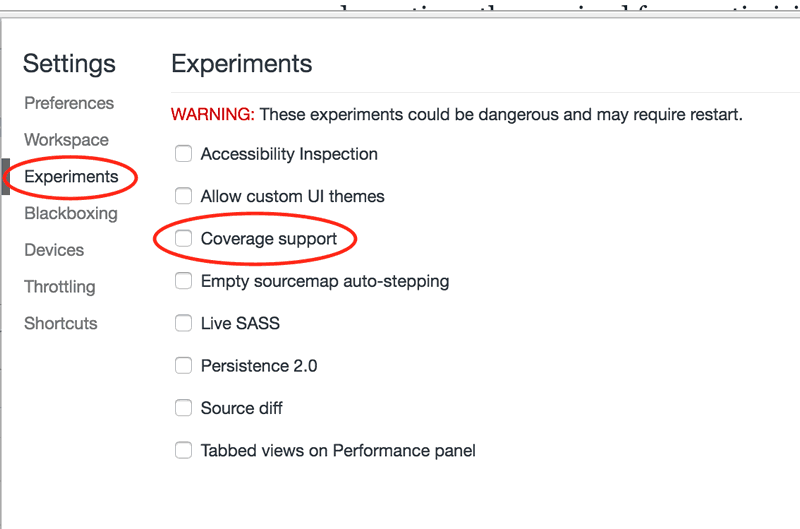
- There should now be an ‘Experiments’ tab. Here, enable the ‘Coverage support’ option. Once this is enabled, you can use this feature on any page (or group of pages) you want.
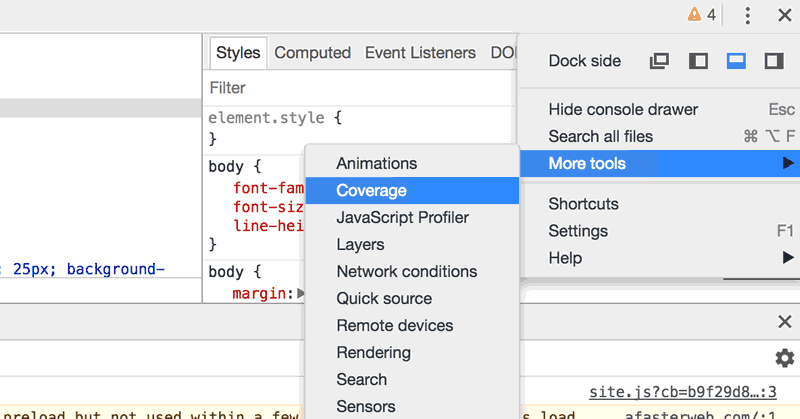
- To use this feature, go to the page (or site) you want to test out, and go to Dev Tools > More Tools > Coverage. A ‘Coverage’ tab should show up next to the Console tab (you may need to re-open your browser tab, if you just enabled the feature).
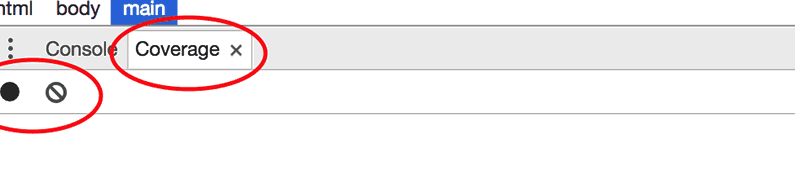
- In the ‘Coverage’ tab, you’ll see a gray circle that turns red when you click on it. This is the record button that will start the test.
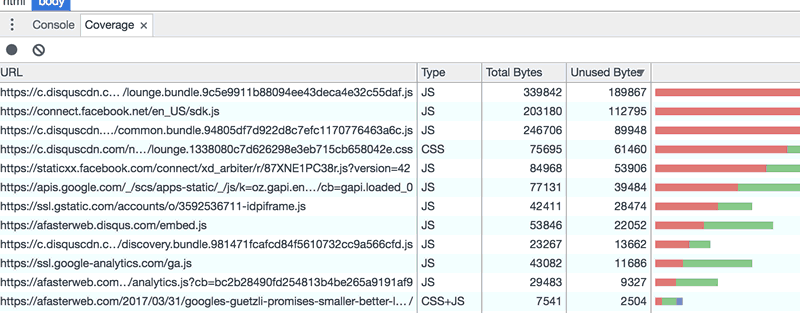
- Once you’ve started the test, click around the page (or pages) as you normally would. When you’re done, hit the red button again to stop recording. Chrome will then calculate how much of the various JS and CSS files that were loaded by the page (or pages) you browsed were actually used.
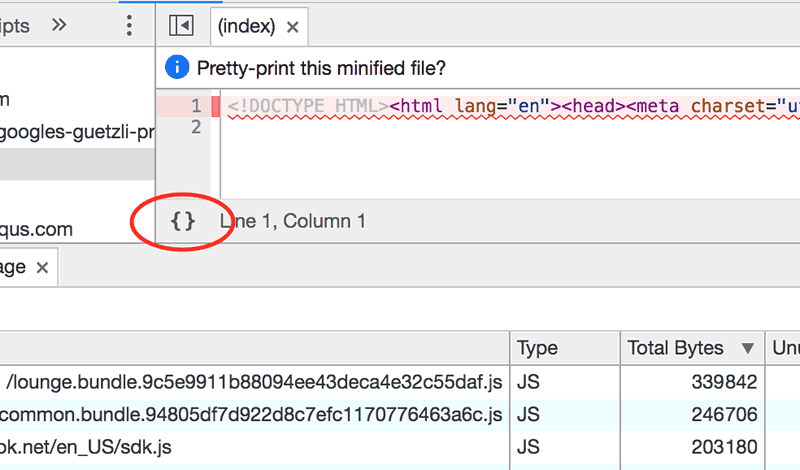
- If you double click on the file, it will bring it up in the ‘Sources’ tab within Dev Tools. There you can see line-by-line what parts of the file were used or not used on that page. And if the file was minified, you click the two brackets ({ }) at the bottom to ‘pretty print’ the format of the file, making it much easier to review.
The nice thing about this is you can hit record and go to as many pages (or sites, even) and gather the results. This means, you could click through your entire site, do all the actions that a user would normally do, and at the end, have a decent idea of how much of your JS and CSS are actually being used.
Clean Up Time
The value I see in this tool is it enables a quick overview of places that may be great opportunities for removing unnecessary code. It can be easy for code to build up over time, and so it’s important to revisit the code we’re using to make sure it’s still necessary. Because although compression and minification are great, not sending unnecessary code to start with is even better.